Plastics have fueled global growth across various industries, but at an increasing environmental, economic, and social cost.
Today, plastic pollution represents a systemic and transboundary crisis, disproportionately affecting developing countries that have limited capacity for waste management.
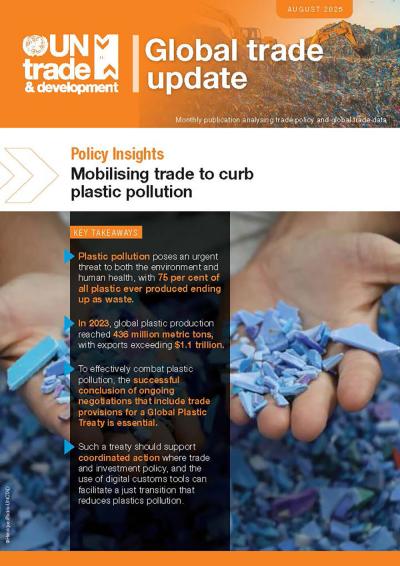
$1.1 trillion in plastic trade, but 75% ends up as waste
In 2023, global plastic production reached 436 million metric tons, while trade in plastics surpassed $1.1 trillion, accounting for 5% of global merchandise trade. However, 75% of all plastic ever produced has become waste, much of which leaks into oceans and ecosystems.
This growing imbalance threatens public health, food systems, ecosystems, and long-term development, especially in small island and coastal nations.
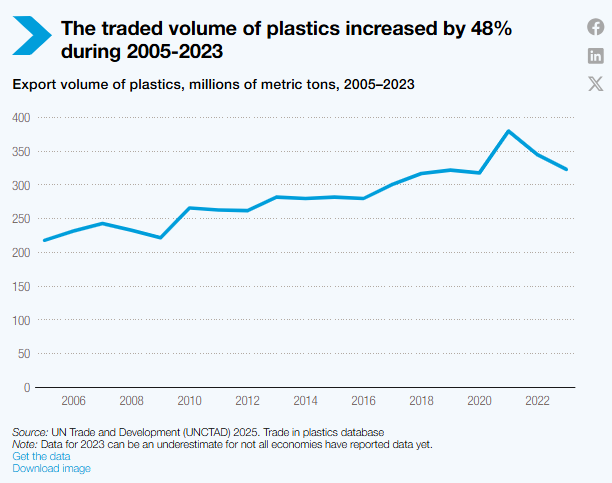
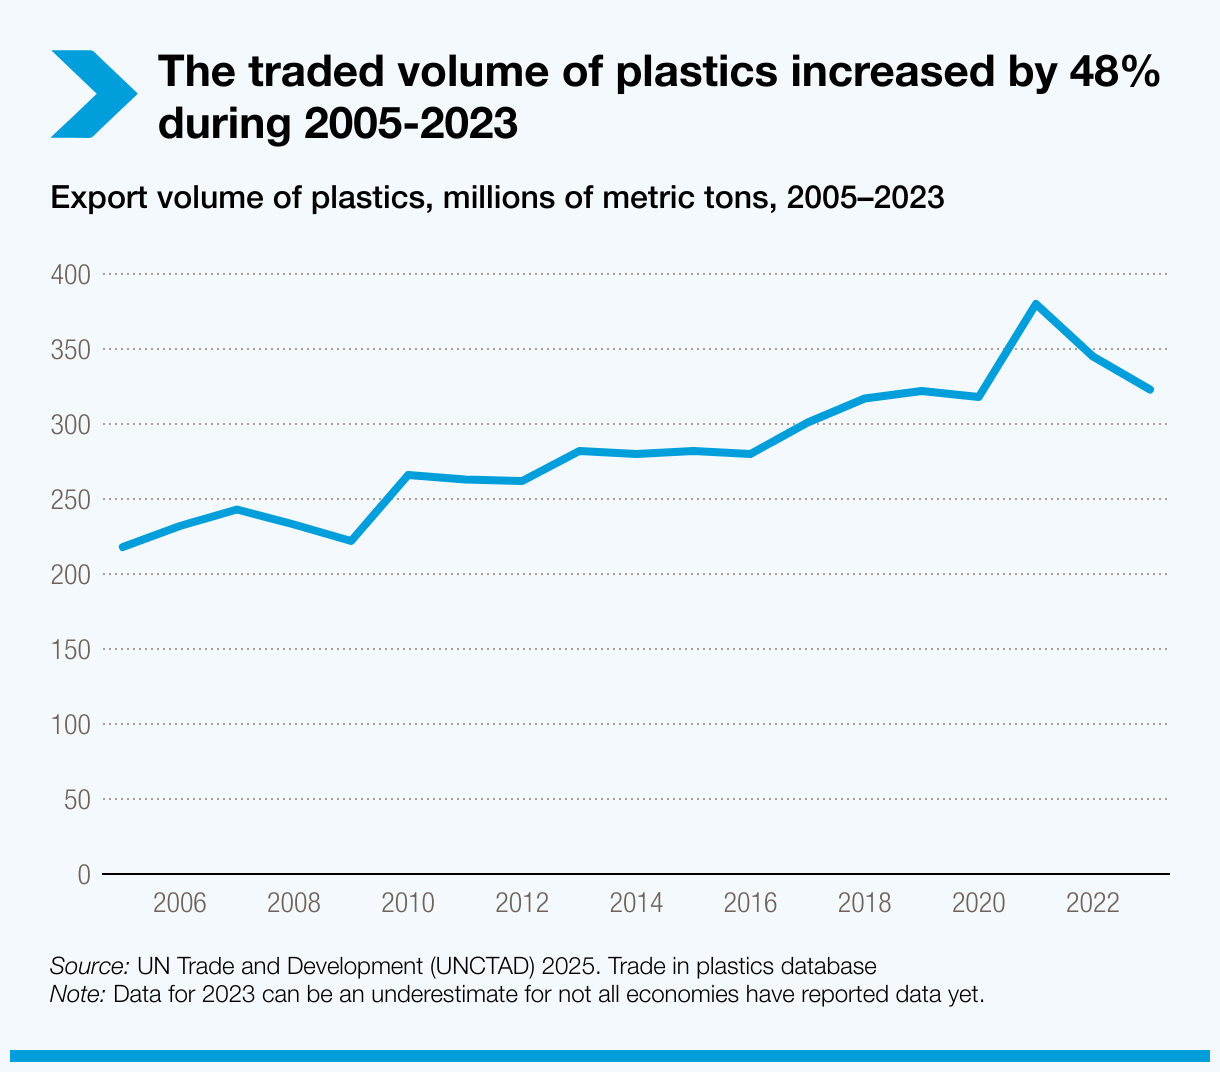
The traded volume of plastics increased by 48% during 2005-2023
Export volume of plastics, millions of metric tons, 2005–202320062008201020122014201620182020202205010015020025030035040020102662010266Source: UN Trade and Development (UNCTAD) 2025. Trade in plastics databaseNote: Data for 2023 can be an underestimate for not all economies have reported data yet.Get the dataDownload image
Tariffs make plastics cheap but penalize natural substitutes
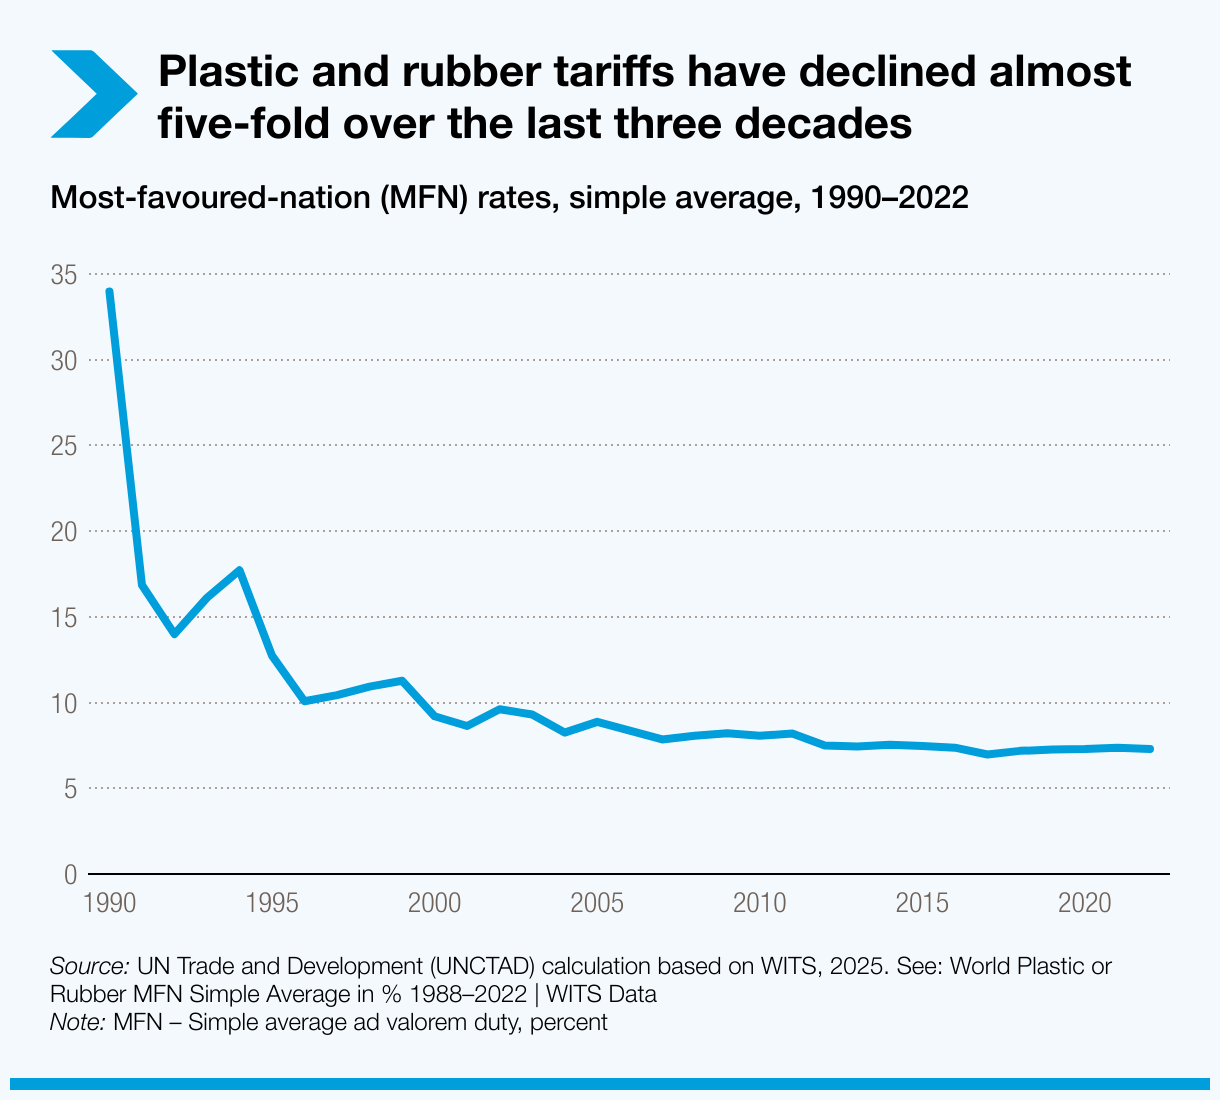
The average Most Favored Nation (MFN) tariffs on plastic and rubber products have decreased from 34% to 7.2% over the past three decades, making fossil fuel-based plastics artificially inexpensive.
In contrast, natural alternatives such as paper, bamboo, natural fibers, and seaweed face average MFN tariffs of 14.4%.
These disparities in how materials are treated discourage investment in alternative products and hinder innovation in developing countries that aim to export safer and more sustainable alternatives to fossil fuel-based plastics.
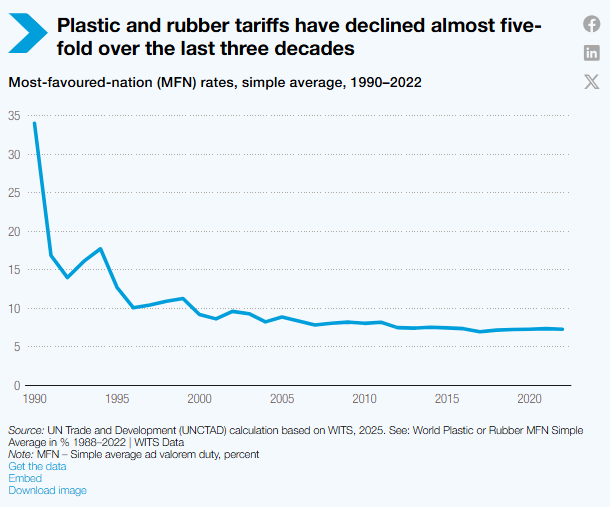
Plastic and rubber tariffs have declined almost five-fold over the last three decades
Most-favoured-nation (MFN) rates, simple average, 1990–202219901995200020052010201520200510152025303520009.220009.2Source: UN Trade and Development (UNCTAD) calculation based on WITS, 2025. See: World Plastic or Rubber MFN Simple Average in % 1988–2022 | WITS DataNote: MFN – Simple average ad valorem duty, percentGet the dataEmbedDownload image
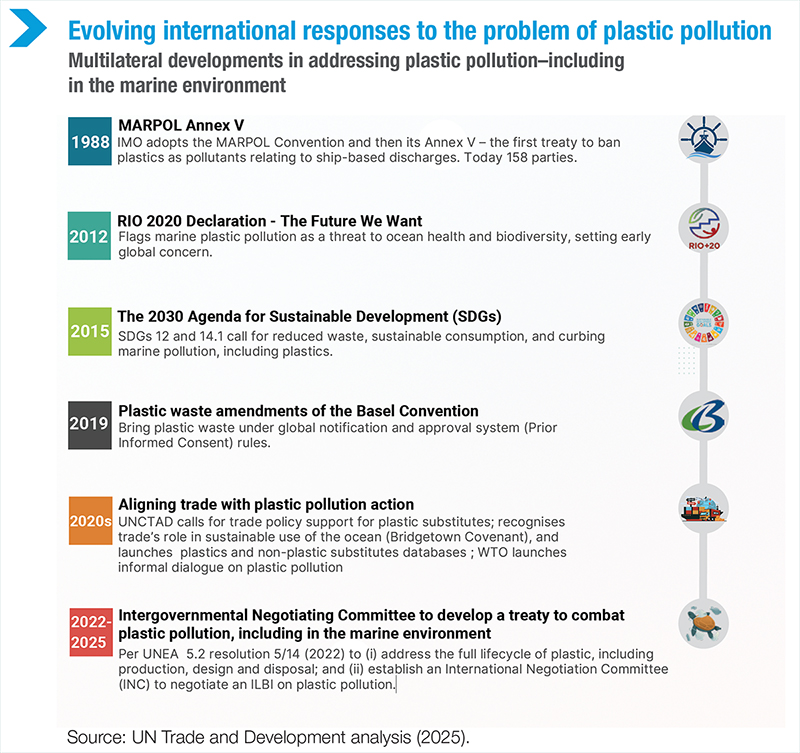
Plastic pollution outpaces global policy response
Although plastics are directly linked to the triple planetary crisis—pollution, biodiversity loss, and climate change—there is still no comprehensive international treaty governing their composition, design, production, trade, and disposal.
With 98% of plastics derived from fossil fuels, emissions and environmental damage are expected to rise without coordinated multilateral action. Efforts to address these issues have been fragmented and incremental since the late 1980s.
Ongoing negotiations for a legally binding international instrument against plastic pollution hold promise for a comprehensive global response that encompasses the entire lifecycle of plastics.
Countries are acting, but regulations are uneven and burdensome
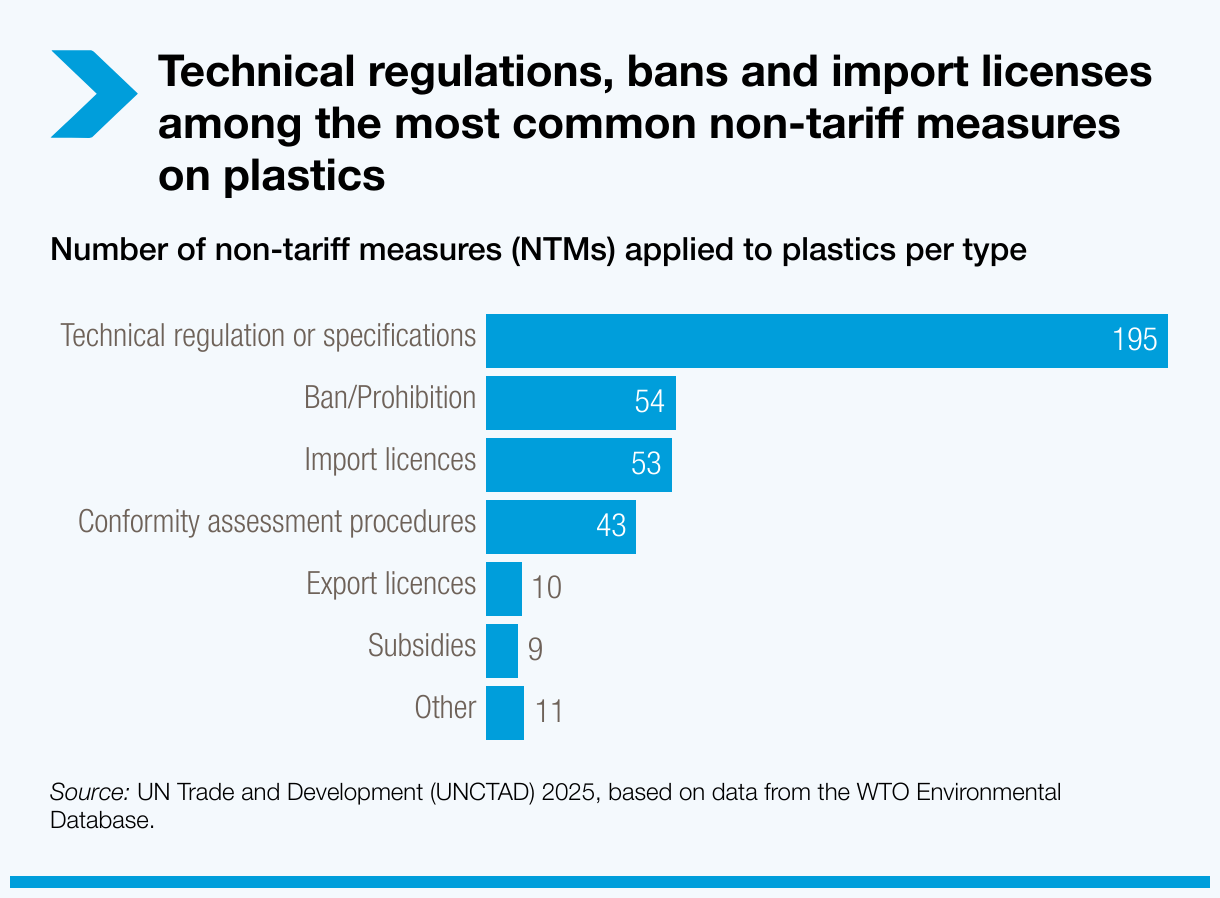
Many countries are employing non-tariff measures (NTMs) to restrict the flow of harmful plastics through bans, labeling requirements, and product standards. However, the lack of alignment among these regulations increases compliance costs and slows trade in safer and more sustainable goods.
Small businesses and low-income exporters often struggle to navigate overlapping or inconsistent requirements, which limit their ability to engage in sustainable trade.
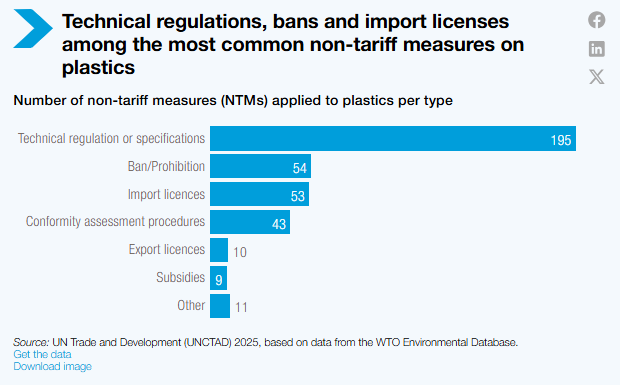
Technical regulations, bans and import licenses among the most common non-tariff measures on plastics
Number of non-tariff measures (NTMs) applied to plastics per typeTechnical regulation or specifications195Ban/Prohibition54Import licences53Conformity assessment procedures43Export licences10Subsidies9Other11Source: UN Trade and Development (UNCTAD) 2025, based on data from the WTO Environmental Database.Get the dataDownload image
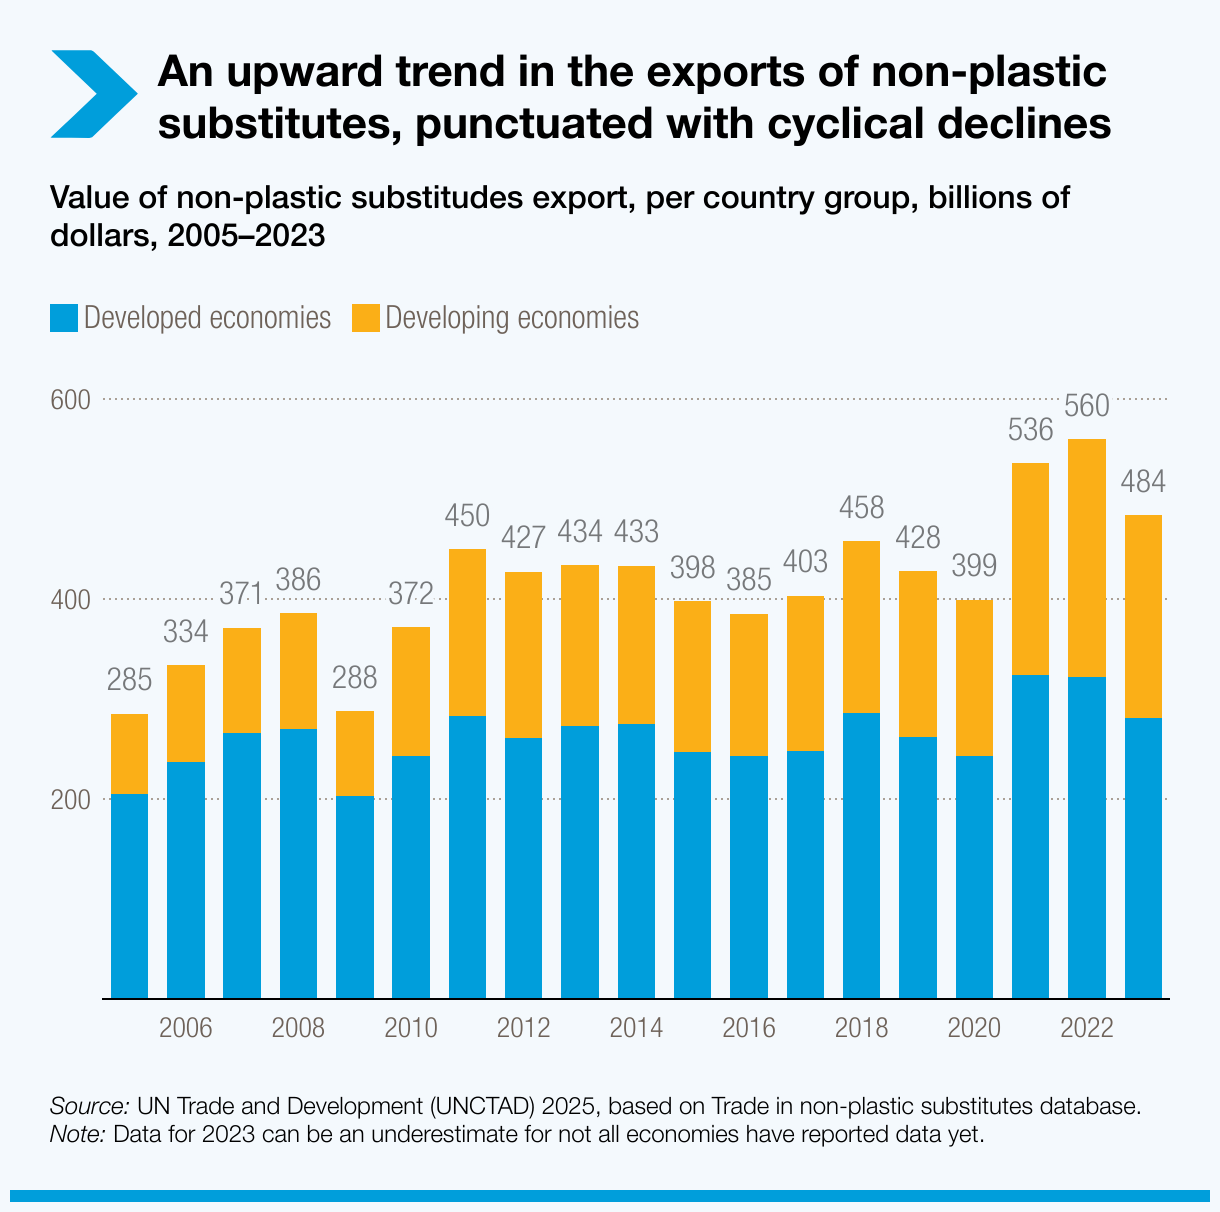
The $485 billion market for substitutes is growing but under-supported
In 2023, global trade in non-plastic substitutes reached $485 billion, with developing countries experiencing annual growth of 5.6%.
These substitutes, derived from mineral, plant, and animal sources, are biodegradable, compostable, or recyclable materials such as glass, seaweed, and natural fibers. However, high tariffs, limited market access, and weak regulatory incentives hinder the scale-up of these sustainable alternatives.
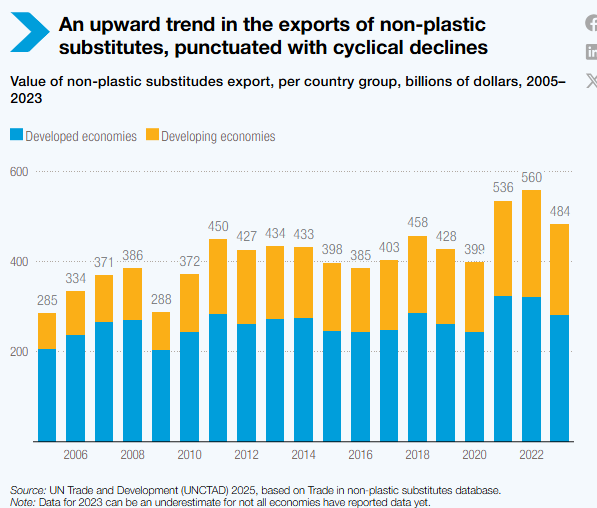
An upward trend in the exports of non-plastic substitutes, punctuated with cyclical declines
Value of non-plastic substitudes export, per country group, billions of dollars, 2005–2023Developed economiesDeveloping economies200400600200620082010201220142016201820202022205802379726610527011620385243129283167261166273161275158247151243142248155286172262166243156324212322238281203285334371386288372450427434433398385403458428399536560484Source: UN Trade and Development (UNCTAD) 2025, based on Trade in non-plastic substitutes database.Note: Data for 2023 can be an underestimate for not all economies have reported data yet.Get the dataDownload image
Time for a treaty that aligns trade and sustainability
The upcoming Global Plastics Treaty presents a critical opportunity to integrate trade, finance, and digital systems into a cohesive global response. Without aligning trade practices, plastic flows and pollution will continue to rise.
A successful treaty should include:
- Tariff and NTM reforms to support sustainable substitutes
- Investment in waste management and circular infrastructure
- Digital tools for traceability and customs compliance
- Policy coherence across the WTO, UNFCCC, Basel Convention, and regional frameworks.
Trade must be part of the solution, not part of the problem.
Source : unctad