In the silence of the sea routes, thousands of ships carry the world’s energy and raw materials every day. Behind these maps seen on television, a company of French origin has made the oceans readable in real time.
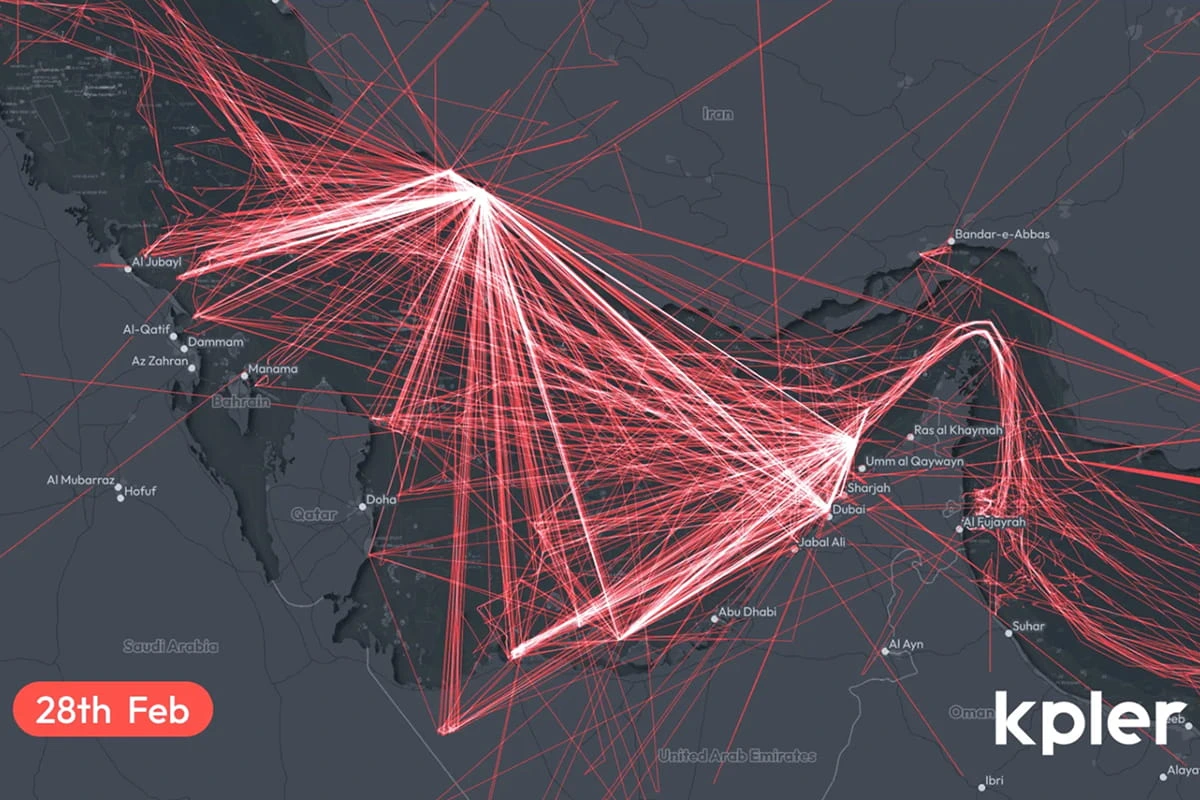
Who hasn’t seen this map with green or red dots on a media outlet, a television channel?
Key sheet: Kpler and live global maritime tracking
The key benchmarks to understand the ship maps that appear in the news
| Company | Kpler, a company of French origin founded in 2014 by François Cazor and Jean Maynier |
| Technology | AIS Automatic Identification System, supplemented by satellites and port data |
| Network | Thousands of coastal antennas and more than 13,000 AIS receivers according to Kpler public data |
| Enriched data | Payload, cargo, roads, volumes and commodity markets |
| Visual reading | Tankers often identified in green, alerts and sensitive areas in red |
What was once industrial secrecy is now becoming a fine reading of the world economy. With its collection and analysis technologies, the French company Kpler has established itself as a privileged observer of these invisible movements. From the AIS signal to the data enriched called payload, the company builds a dynamic mapping of global exchanges.
Observing the oceans has long been a matter of radars, human watchdogs and port reports. Today, this look has shifted to data. Each ship becomes a mobile source of information, each route a usable trace. This change is based on a global technical infrastructure that combines coastal antennas, satellites, port bases and algorithmic intelligence.
In this landscape, real-time maritime tracking goes far beyond simple geolocation. It makes it possible to understand economic logics, to anticipate market tensions and to inform strategic decisions. Energy flows, especially oil, have become readable on an unprecedented scale.
Kpler occupies a unique place in this new data economy. Founded in 2014 by two French engineers, François Cazor and Jean Maynier, the company has developed internationally around a clear promise: to make commodity markets more transparent. The company is now often cited in the energy, logistics and trading circles. It also appears, indirectly, in the daily life of the general public when a news channel shows an animated map of maritime traffic in the Red Sea, in the Strait of Hormuz, in the Black Sea or off major world ports.
On digital maps, ships draw invisible lines between continents. These lines tell a story made of resources, exchanges and fragile balances.
The principle is simple in appearance. Each ship emits a signal. But the challenge lies in the interpretation of these signals. Crossed with other sources, they reveal essential information: nature of the cargo, volumes transported, real destinations and possible disruptions. In a world marked by energy crises, sanctions, conflicts and geopolitical recompositions, this ability to see becomes a strategic lever.
Why Kpler became visible in the media
The name Kpler sometimes remains discreet for the general public. Yet its maps and data now fuel part of the visual representation of globalization. When a maritime crisis occupies the news, the editorial staff seeks to show what is happening at sea. Maritime traffic maps then make it possible to make visible a reality that is difficult to film: the presence of ships, road diversions, concentration zones and slowdowns.
On the news channels, these cards have taken on an almost educational function. They explain in a few seconds why an attack in the Red Sea can weigh on delivery times, why a blockage near a strategic strait can worry oil markets or why tankers suddenly change course.
This media visibility is due to a transformation of economic and geopolitical journalism. The card is no longer a simple decor. It becomes a visual proof, a tool for explanation and sometimes a warning signal. In this current grammar, Kpler appears as one of the actors capable of transforming an ocean of technical information into an understandable image.
When a ship map appears on the screen, it often tells more than maritime traffic: it shows the tensions of the world.
How the AIS system at the heart of maritime tracking works
The AIS system is the backbone of modern maritime tracking. Installed on board ships, it continuously transmits essential information. Position, speed, course, ship identity and navigation data are broadcast automatically.
This signal is picked up by a network of antennas located along the coasts. These stations allow high precision in port areas and busy sea routes. Added to this is a satellite layer that takes over on the high seas, when ships leave the range of land antennas.
This hybrid device provides continuity of observation. It’s not just about seeing a point on a map but following a trajectory over time. This trajectory becomes usable information, which can be crossed with stopovers, loading ports, commercial declarations and market data.
Why antennas and satellites change the view of the oceans
The global network is based on thousands of antennas spread over the coasts. These infrastructures capture AIS signals near land, around ports, straits, oil terminals and major trade routes. Their scope remains linked to geography, installation height and reception conditions.
To cover the vast oceanic spaces, satellites come into play. They intercept AIS transmissions from orbit and allow ships to be tracked on the high seas. Kpler’s public data now evoke more than 13,000 receivers on terrestrial, satellite and relay networks, with coverage in more than 190 countries.
The result is almost continuous visibility of ships on a global scale. This system does not remove all shadow areas but it greatly reduces blind spots. And above all, it makes it possible to reconstruct the sea routes as a whole, from the coast to the open oceans.
What does payload really mean in the analysis of maritime flows
The term payload here refers to enriched data. It is not only about the information emitted by the ship but about its transformation into exploitable intelligence. The ship is no longer only identified by its position. It is placed back in a commercial chain.
Thanks to the crossing of multiple sources, platforms like Kpler associate a ship with its cargo. Crude oil, liquefied natural gas, refined products, minerals, cereals or coal become identifiable in a flow logic. This capacity changes the nature of maritime monitoring. We no longer only look at movements but at economic exchanges.
The payload thus makes it possible to link the map to the material transported. A tanker at sea can become a sign of an energy supply. A store stock can announce an agricultural or mining dynamic. A slowdown in a port area can signal logistical tension. In this reading, the ship becomes both a physical object and an advanced indicator.
How green and red colors reflect a strategic reading
On tracking interfaces, visual representation plays a key role. Tankers often appear in green, a color that allows you to quickly identify major energy flows, including oil and refined products.
Red indicates sensitive situations. These can be risk areas, atypical behaviors, roads under surveillance or points of tension. This codification allows a quick reading of the issues, even for an audience that does not know the details of maritime navigation.
It transforms a technical map into an analysis tool. At a glance, the user identifies the dominant flows, the concentrations of ships and the possible ruptures. This is precisely what explains its success in the media: a ship map makes it possible to tell a crisis without the need for spectacular images.
How this real-time tracking influences global markets
Maritime tracking is not only for observation. It allows you to anticipate. By analyzing flows, economic actors can predict market developments, identify port congestion or identify road diversions.
An increase in the number of tankers in an area may indicate an accumulation of stocks. A change in roads can reveal the impact of sanctions, attacks, droughts affecting a canal or new insurance constraints. The energy, transportation and raw materials markets often react to these weak signals.
This system is not limited to informing but it informs decisions. It becomes a strategic tool for traders, industrialists, logisticians, insurers and states. In a globalized economy, maritime data becomes a form of economic intelligence.
Why a company of French origin interests investors
Kpler’s journey also tells another story: that of a company born in data, which has become a strategic asset. Market information recently published by Reuters mentions a recurring annual revenue of about $300 million and a potential valuation of up to several billion dollars as part of a minority operation.
This trajectory illustrates the value taken by proprietary data. In world trade, the one who knows before the others where the cargoes are, where they are going and when they will arrive has a considerable advantage. Kpler has developed in this space, between technology, energy, maritime and geopolitics.
This growth is also explained by the need for transparency in long-opaque markets. Raw materials circulate through complex chains. The data makes it possible to shorten the analysis time and to better understand the imbalances between supply and demand.
In this new geography, the oceans are no longer just transit spaces. They become information territories, where every signal counts. Kpler, a company of French origin that has become a global player, embodies this change: that of a world where the map no longer shows only ships but the tensions, needs and dependencies of the global economy.
source : aquitaine online